What the 2026 paid-social creative benchmark actually measured
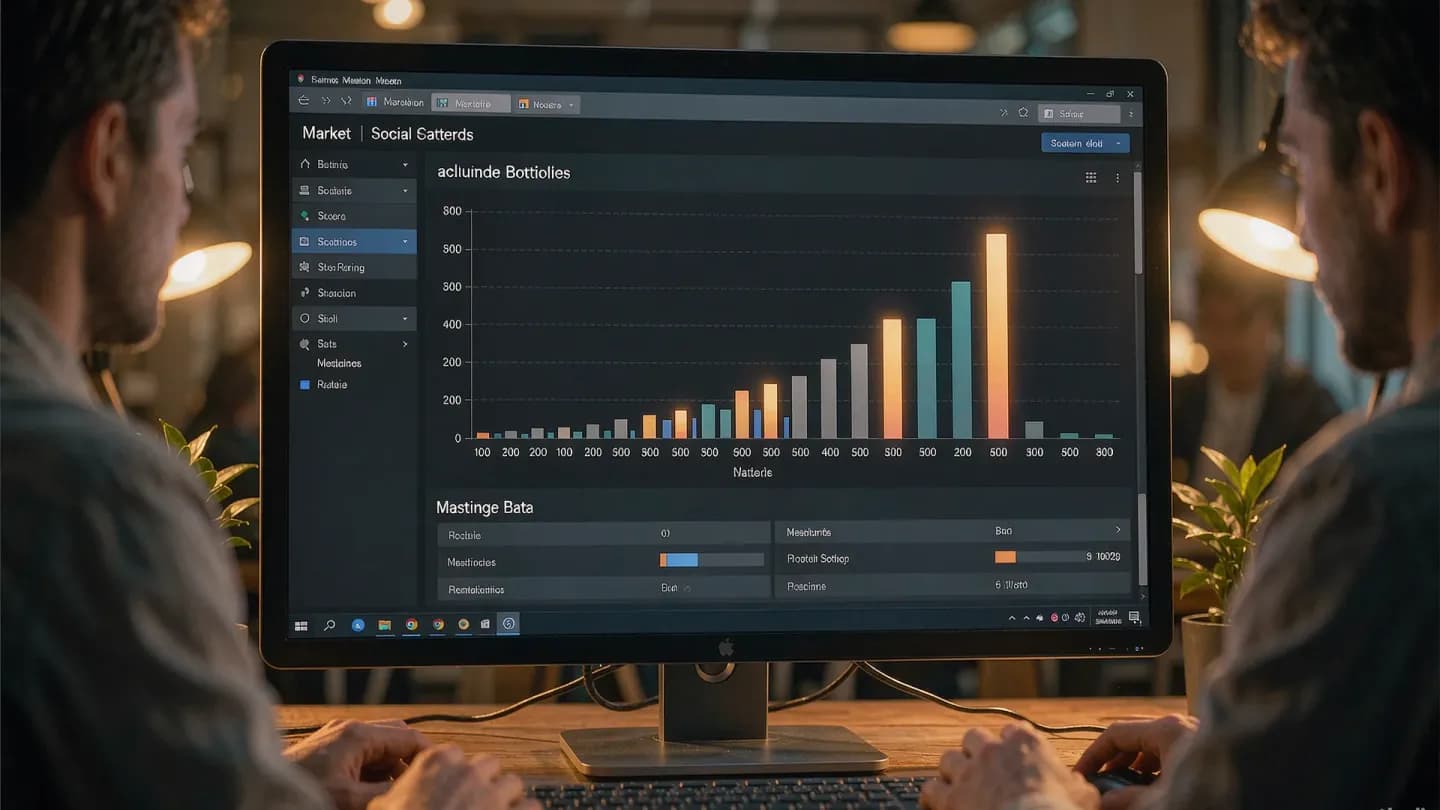
The 2026 paid-social creative benchmark is the clearest picture yet of how video ad money actually moves. Motion's analysis covered $1.29 billion in realized Meta ad spend across 578,750 creatives and 6,015 advertiser accounts, and it looked only at where the auction chose to place budget.
The dataset is the broader backbone behind the {{link}} that commercial teams already track every quarter. What it found is uncomfortable: creative performance in paid social is not a bell curve, it is a power law.
A winner in this benchmark is a creative that spent at least ten times the account's median creative spend and at least $500 in absolute terms. That threshold sits at the 92.3rd percentile of the ratio-to-median spread, so only about 7.7% of creatives even clear it.
For AI video teams the benchmark arrives at an awkward moment. Generation has made producing a single clip nearly free, which tempts programs to flood the auction with volume and call it a strategy. The 2026 numbers are the corrective: the auction does not reward volume, it rewards the rare cut that earns sustained spend.
The dataset is the broader backbone behind the 2026 video marketing statistics that commercial teams already track every quarter. What it found is uncomfortable: creative performance in paid social is not a bell curve, it is a power law.
Only about 5% of creatives become winners
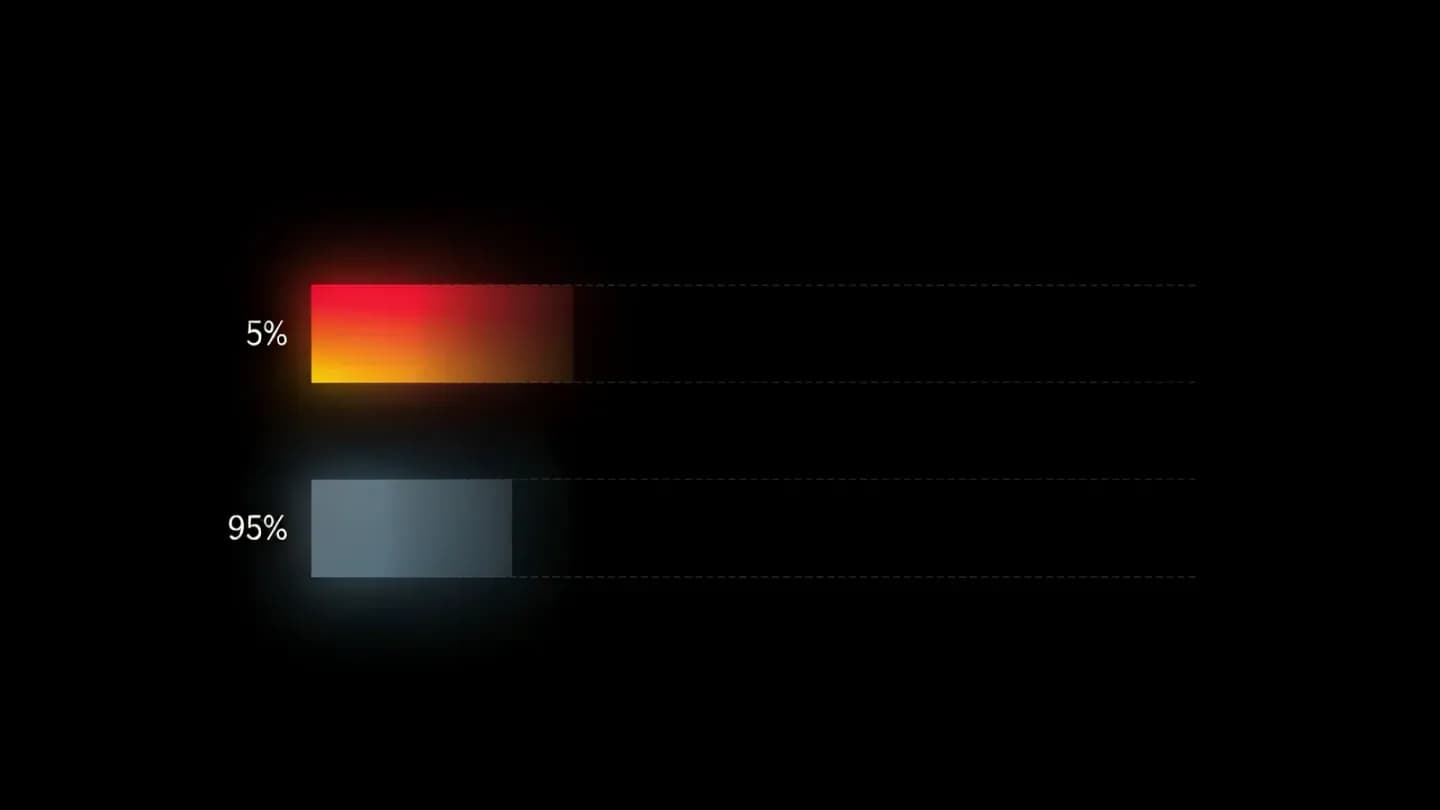
Only about 5% of the 578,750 creatives qualified as winners. For every hundred videos a team ships, roughly five capture the outsized spend while the other ninety-five divide the leftovers. This is a statistical feature of large auction portfolios, not a verdict on any single creative's craft.
It also reframes a common fear. Generative models have reached the point where {{link}} on click-through and conversion, so the gap between a human-made and a machine-made cut is no longer the deciding factor. What decides is whether the cut lands in the winning slice at all.
The five percent figure is a description of the distribution's shape, not a target to hit. Pushing more creatives into the account shifts the whole curve outward, yet the winning share stays pinned near five percent. The useful move is to make that five percent easier to find, not to manufacture a hundred marginal copies and hope one lands.
The practical read for a commercial team is to stop counting outputs and start counting distinct concepts entering the auction each week. If ninety-five of every hundred creatives are destined for the long tail, the only lever that matters is surfacing more genuinely different ideas, because each distinct idea is a fresh lottery ticket while each near-copy is a duplicate of one already bought.
It also reframes a common fear. Generative models have reached the point where AI video creative parity on click-through and conversion, so the gap between a human-made and a machine-made cut is no longer the deciding factor. What decides is whether the cut lands in the winning slice at all.
Where the budget actually concentrates
Concentration is the sharper number. Across the entire dataset, 55% of total Meta ad spend landed on winning creatives. At the Micro tier that share was 23%; at the Enterprise tier it rose to 64%. Spend does not spread evenly — it piles onto the few winners, and the pile grows with account scale.
For commercial teams this is the real risk surface. A portfolio that ships volume but never promotes winners is funding a long tail the auction quietly starves. The benchmark treats spend concentration as the signal, not the bug: the auction is telling you which creatives earned their keep, and the rest are noise.
The budgeting implication is direct. If 64% of enterprise spend flows to winners, then a team's testing budget is not the cost of making video — it is the cost of buying lottery tickets at scale. The teams that win are not the ones that spend most on production; they are the ones that structure the ticket-buying as a repeatable system.
Scale compounds the effect. Enterprise accounts that test more creatives per week still see only about five percent winners, yet they capture far more absolute spend because their portfolios are larger and their promotion rules are tighter. The takeaway is not to test less — it is to promote what wins faster than a smaller account would dare to.
Volume buys more tickets, not better odds
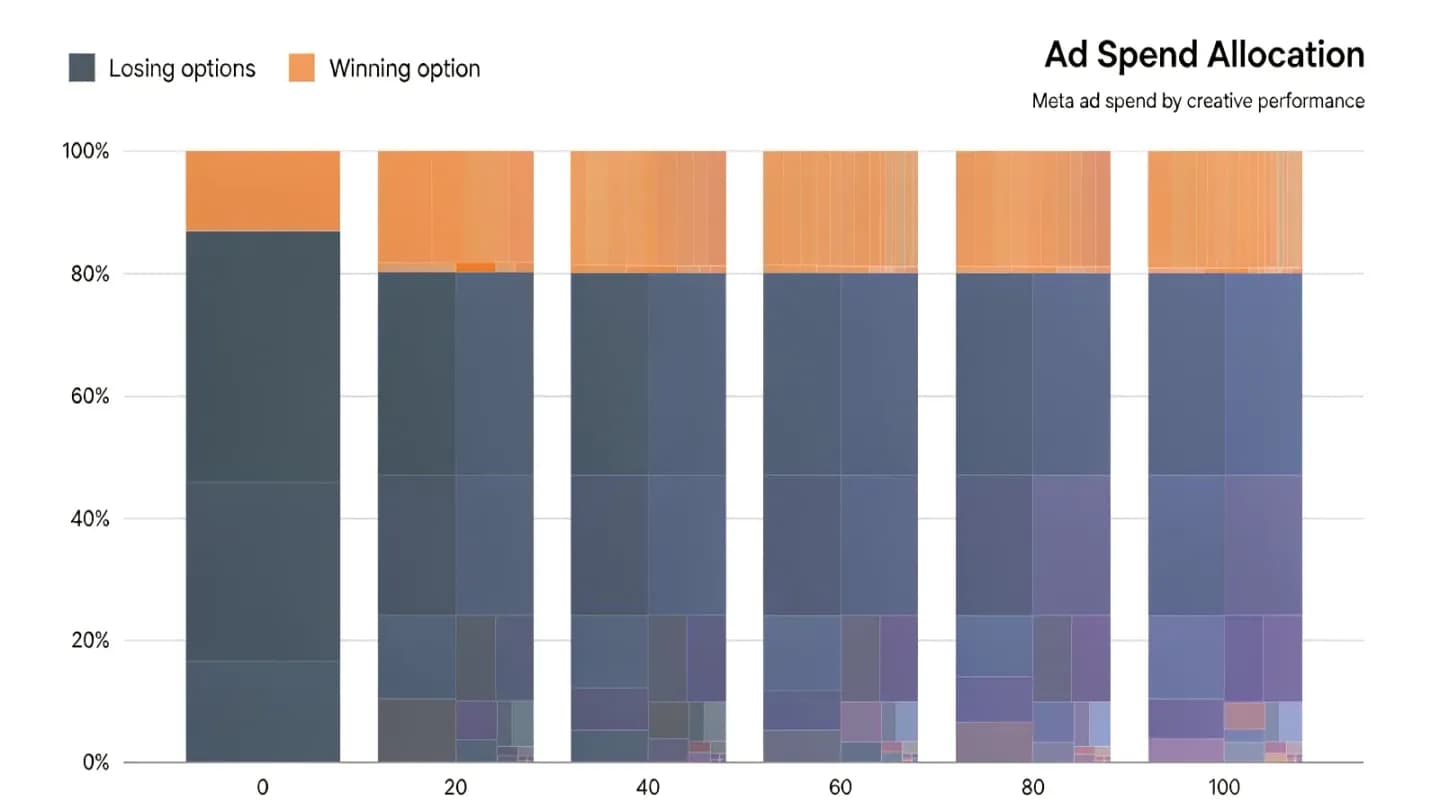
The most misunderstood finding is that scale changes frequency, not fundamentals. Enterprise advertisers launched more creatives per week, yet their per-creative winner odds did not improve. Volume creates more chances to surface a winner; it does not make any individual creative more likely to win. Testing one hundred near-copies of a single concept gives the system one candidate, not one hundred.
That is exactly why near-zero generation cost matters. When {{link}} collapses the price of a usable clip, the constraint stops being production and becomes judgment: deciding which concepts deserve another ten variants and which deserve a quick retirement.
Near-copies are the silent budget leak. Ten variations of one concept fatigue together because the audience reads them as a single ad, so the system funds one candidate at the cost of ten productions. Distinct concepts with a different hook, format, or offer are what give the auction ten separate things to evaluate, and evaluation is what produces winners.
That is exactly why near-zero generation cost matters. When AI video testing economics collapses the price of a usable clip, the constraint stops being production and becomes judgment: deciding which concepts deserve another ten variants and which deserve a quick retirement.
The portfolio discipline the benchmark implies
Read as operating advice, the benchmark points to a simple loop: decide one variable per batch, fund enough variants to reach a read, run each test for at least seven days, then promote winners and iterate forty to fifty percent of the next batch as variations on them. Superscale's tier data puts winning accounts at two to four new variants a week in the fifty-to-one-hundred-thousand range, with only about 2% ever scaling.
The payoff is measurable. Teams that run this loop avoid the trap where {{link}} even as adoption climbs, because they compound winner rate instead of spraying reach. A portfolio that retires losers inside forty-eight to seventy-two hours stops paying for creative the auction has already judged.
The promotion and kill rules are where most programs break. A winner should move into scaling the moment it clears a seven-day read, and a loser should leave rotation before it burns the next cycle's budget. Treating the account like a portfolio means accepting that most entries will be cut, and that acceptance is precisely the mechanism that works.
The payoff is measurable. Teams that run this loop avoid the trap where AI video ROI reversal even as adoption climbs, because they compound winner rate instead of spraying reach. A portfolio that retires losers inside forty-eight to seventy-two hours stops paying for creative the auction has already judged.
What commercial teams should ship next
The practical takeaway is unglamorous. Build a creative portfolio like a fund: a steady stream of distinct concepts, a ruthless promotion rule for winners, and a kill rule for anything that has had its shot. Three genuinely different angles beat ten crops of the same video, because the audience experiences near-copies as one ad.
AI generation did not change the power law — it changed who can afford to test against it. A team that once shipped five videos a quarter can now ship fifty, and fifty is the volume the benchmark says separates accounts that find winners from those that do not. The advantage now belongs to teams that treat testing as a system, not a sprint.
None of this requires a bigger team. It requires a shared definition of a winner, a fixed cadence for testing, and the discipline to kill what does not work. The benchmark is a mirror: it shows whether a team's creative program is a portfolio or a pile.
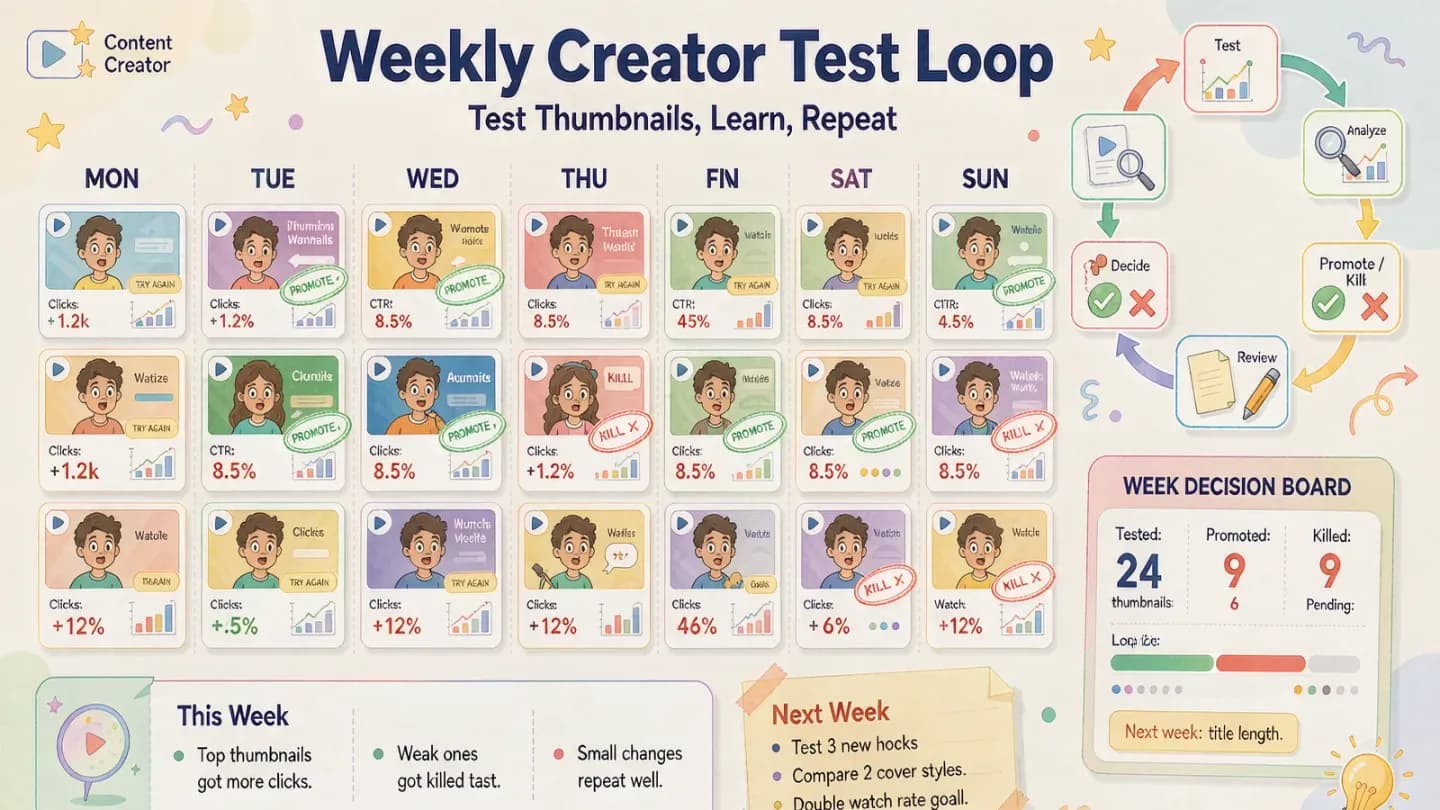
Measurement closes the loop. A weekly creative report that prints winner, watch, and kill rows turns last week's verdicts into next week's brief, and that compounding is what separates a system from a pile. The benchmark is not a verdict on creativity; it is a description of the auction, and the auction is the referee every commercial video team is already playing against.
Put the framework into production
These related pages connect the article’s planning advice to a specific commercial scope.
References
- Motion 2026 Creative BenchmarksMotion
Analysis of $1.29B realized Meta ad spend across 578,750 creatives and 6,015 accounts; ~5% of creatives are winners (>=10x account median spend and >=$500); 55% of spend on winners, rising to 64% at the Enterprise tier.
- Creative Testing Benchmarks 2026: How Many Ads to Test?Superscale
Winning accounts in the $50k-100k/mo range test 2-4 new variants per week; only ~2% of tested creatives become scalable winners; 10-20% of channel spend on testing, 80-90% behind proven winners.
- 2026 IAB Digital Video Ad Spend & Strategy Report: Part OneIAB
U.S. digital video ad spend projected to surpass $80B in 2026, growing 11% year over year and nearly 20% faster than the total ad market; digital video expected to exceed 60% of total TV/video ad spend.