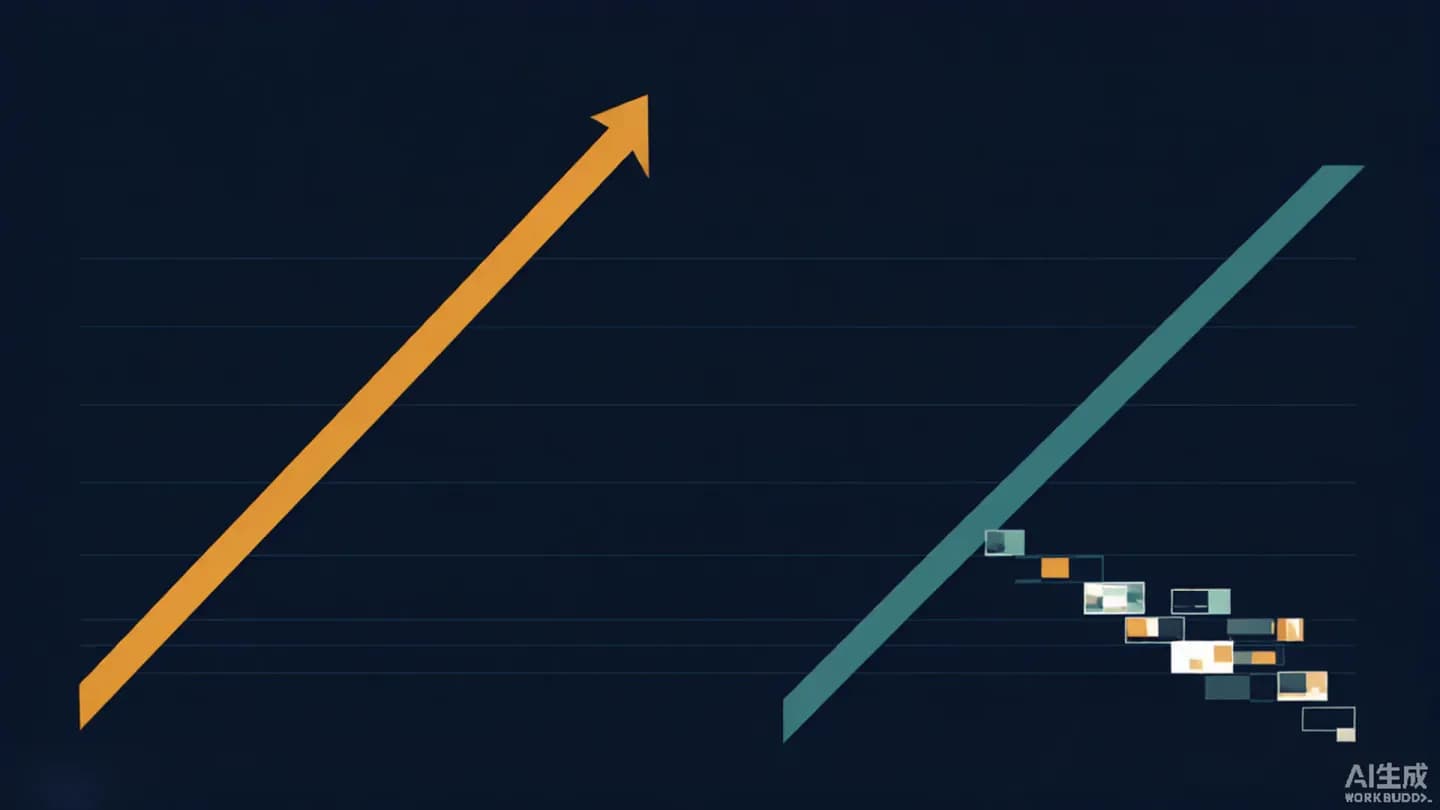
The 2026 Reach-Attention Inversion
Metricool's 2026 YouTube Study analysed 799,718 videos from 71,177 accounts, comparing February 2025 with February 2026. Long-form views rose 76% year over year. Engagement on those same videos fell 45%. Shorts views climbed 127%, but viewers spent roughly three times less time on each one. Two curves that used to move together have come apart, and the resulting video engagement decline now sits underneath every downstream number in a brand video plan.
The Shorts feed generates 61% of all YouTube views, which means most of a brand's exposure now arrives through an algorithmic surface the viewer never chose to open. Money followed attention rather than impressions: ad impressions, monetised playbacks and estimated ad revenue all fell by more than half over the same period. A media plan built on view counts will look healthy for several quarters while the business case underneath it erodes. The failure mode is not underperformance. It is misreading a growth chart.
This tends to get filed as a creator-economy story, and that filing is a mistake. The same feed carries your brand film, your product explainer and your paid social cut, under identical distribution physics. YouTube's own framing does not contradict the data either: the platform reports that Shorts averages 200 billion daily views, a scale that guarantees exposure and guarantees nothing else. Treating that scale as a win condition is how teams end up with record reach and a flat pipeline.
What the Video Engagement Decline Actually Measures
The phrase hides three separate movements, and conflating them produces bad decisions. The first is duration: average view duration on long-form fell from roughly four minutes to about two and a half. The second is interaction rate, which dropped 45% — a far steeper fall than the 4% decline in raw interaction counts, because the denominator exploded. The third is monetisable attention, which fell hardest of all, because mid-roll inventory only exists if somebody is still watching.
Only the first is a creative problem in the conventional sense. The second is largely an artefact of algorithmic reach delivering weaker-intent viewers; the third is a downstream consequence of the first. When a team responds to a falling engagement rate by asking the edit to be more engaging, it is optimising against a denominator it does not control. The better first question is whether absolute interactions held — and across this dataset they broadly did.
What genuinely changed is the cost of the opening. A viewer arriving from an infinite-scroll feed rather than a deliberate click has made no commitment, so the first seconds now carry the entire burden of qualifying them. That is why the anatomy of a high-retention opening hook matters more in 2026 than it did two years ago: the intro is no longer a courtesy, it is the whole negotiation.
Rebuild the Portfolio Around Three Jobs
The useful response is structural rather than stylistic. Split the portfolio into three jobs and stop asking any single asset to do all three at once. Discovery assets exist to be found by people who were not looking for you. Conviction assets exist to turn curiosity into belief for people who already arrived. Conversion assets exist to remove the last friction from a decision that has effectively been made.
Each job carries a different success metric, and mixing them is the most common planning error. A discovery cut should be judged on qualified reach and on the share of viewers who continue past the hook, not on completion rate. A conviction piece should be judged on average view duration and returning-viewer share. A conversion cut should be judged on click-through and downstream action, where a twelve-second watch can be a complete success.
Budgeting follows the same split. Discovery is a volume game and should be produced at volume economics; conviction deserves craft budget, because it is where brand equity is actually built. Budget each job separately, and track cost per usable clip rather than cost per finished asset. The alternative — one hero film stretched across all three jobs — now fails in a specific and predictable way: too slow for the feed, and too shallow for the people who stayed.

The First Ten Days Are the Campaign
Metricool found that 83% of interactions on a video occur within the first ten days of publication, with the bulk of views and interactions arriving in the first three. That is a scheduling fact with creative consequences. Community management, paid support and the cross-posting plan are not post-launch housekeeping; they sit inside the asset's performance envelope and should be scoped alongside the edit.
In practice this argues for concentrating effort rather than spreading it thin. Publishing a considered piece into an empty week, with no supporting cuts and nobody moderating comments, wastes the only window in which the algorithm is still deciding what to do with it. Publishing the same piece alongside two derivative short cuts, a pinned question and a small paid push gives the first seventy-two hours something to work with. Paid support compresses that window further, and agentic media buying makes the compression automatic rather than optional.
The corollary is more encouraging. The same study describes YouTube content as having a longer shelf life than feed-native platforms, with a well-optimised video accruing views for months after the interaction window closes. So the ten-day rule governs engagement planning, not asset lifespan. Titles, thumbnails and descriptions keep the long tail alive once the initial burst has passed.

Cadence: Where More Output Stops Paying
Generative tooling made output cheap, which makes cadence the discipline that now matters most. The study puts a hard ceiling on long-form: two to four uploads per week produced the strongest results per video and per month, and posting beyond that did not meaningfully improve either. Channels publishing less than one long-form video a fortnight performed worst overall, because a single asset's outcome became the entire month's result.
Short-form behaves differently, but it is not unbounded. Channels posting around five short cuts a month averaged 8,789 views per long-form video against a 5,985 global average, a lift of roughly 46%. Channels posting thirty-five or more a month lost that lift entirely and landed back where channels posting none did. There is a genuine flywheel between the formats, and it has an operating range.
So the answer to cheaper production is not simply more of everything. It is a deliberate ratio: a small number of conviction assets per month, a modest and consistent stream of discovery cuts, and refresh triggered by measurement rather than by spare capacity. Volume without a disciplined creative refresh cadence simply moves the fatigue curve forward. The teams getting hurt right now are the ones who read cheap generation as permission to publish at whatever rate their tools allow.
Instrument Retention Before You Blame the Creative
Most of these decisions are unmakeable without segment-level retention data, and most teams never open it. YouTube's key moments for audience retention report breaks a video's curve into intros, top moments, spikes and dips, and it is available at video level once a video passes sixty seconds and one hundred views. That second condition quietly excludes a lot of short brand content from the richest diagnostic the platform offers.
The segment views are where the real answers live. The report lets you compare organic traffic against paid traffic, new viewers against returning ones, and subscribers against non-subscribers on the same asset. A cut that retains well organically and collapses on paid traffic does not have a creative problem; it has a targeting or placement problem. Reading the aggregate curve alone would have sent that edit back for no reason.
Definitions matter here too. Average view duration is the average minutes watched among those who stayed to watch, and for short-form it is calculated from engaged views rather than from every impression served. Comparing a short-form number against a long-form number without accounting for that is how teams convince themselves short-form is outperforming.

What This Changes in the Brief
Three changes are worth making immediately. State the job — discovery, conviction or conversion — in the first line of every brief, and attach the single metric that job will be judged on. Specify the opening separately, with its own review gate, because it now decides whether anything else gets seen. Declare the publication window and the supporting assets at brief stage, not at delivery.
The wider context makes the urgency plain. IAB projects U.S. digital video ad spend to surpass $80 billion in 2026, growing 11% year over year and nearly 20% faster than the total ad market, with social video up 13% and outpacing connected TV for the first time. More money is being routed into exactly the surfaces where attention per view is falling fastest. That is a margin problem before it is a creative one, and it resolves at the planning layer rather than in the edit.
None of this requires new tooling. Teams that already run a structured variant testing system have most of the machinery in place; what changes is the question being asked of it. Stop asking which cut got the most views. Start asking which cut earned the most attention from the people you actually wanted, during the ten days when it counted.
Put the framework into production
These related pages connect the article’s planning advice to a specific commercial scope.
References
- Metricool's 2026 YouTube Study Reveals A Slow Burn Effect: More Views, Less Watch Time, & Longer Content Shelf-LifeMetricool
Across 799,718 videos from 71,177 accounts, long-form YouTube views rose 76% year over year while engagement fell 45%; Shorts views rose 127% but viewers spent three times less time on each Short; the Shorts feed generated 61% of views; ad impressions, monetised playbacks and estimated ad revenue all fell by more than 50%; and 83% of interactions occurred within the first ten days.
- From the CEO: What's coming to YouTube in 2026YouTube Official Blog
YouTube states that Shorts now averages 200 billion daily views and that it is integrating additional formats, including image posts, directly into the Shorts feed.
- Measure key moments for audience retentionYouTube Help
The key moments for audience retention report highlights intros, top moments, spikes and dips, requires a video of at least 60 seconds with at least 100 views, and supports segment comparisons of organic versus paid traffic, new versus returning viewers, and subscribers versus non-subscribers; average view duration is defined as the average minutes watched among those who stayed to watch, calculated from engaged views for Shorts.
- 2026 IAB Digital Video Ad Spend & Strategy Report, Part OneIAB (Interactive Advertising Bureau)
U.S. digital video ad spend will surpass $80B in 2026, growing 11% year over year — nearly 20% faster than the total ad market — and will exceed 60% of total TV/video spend for the first time, with social video growth outpacing CTV.