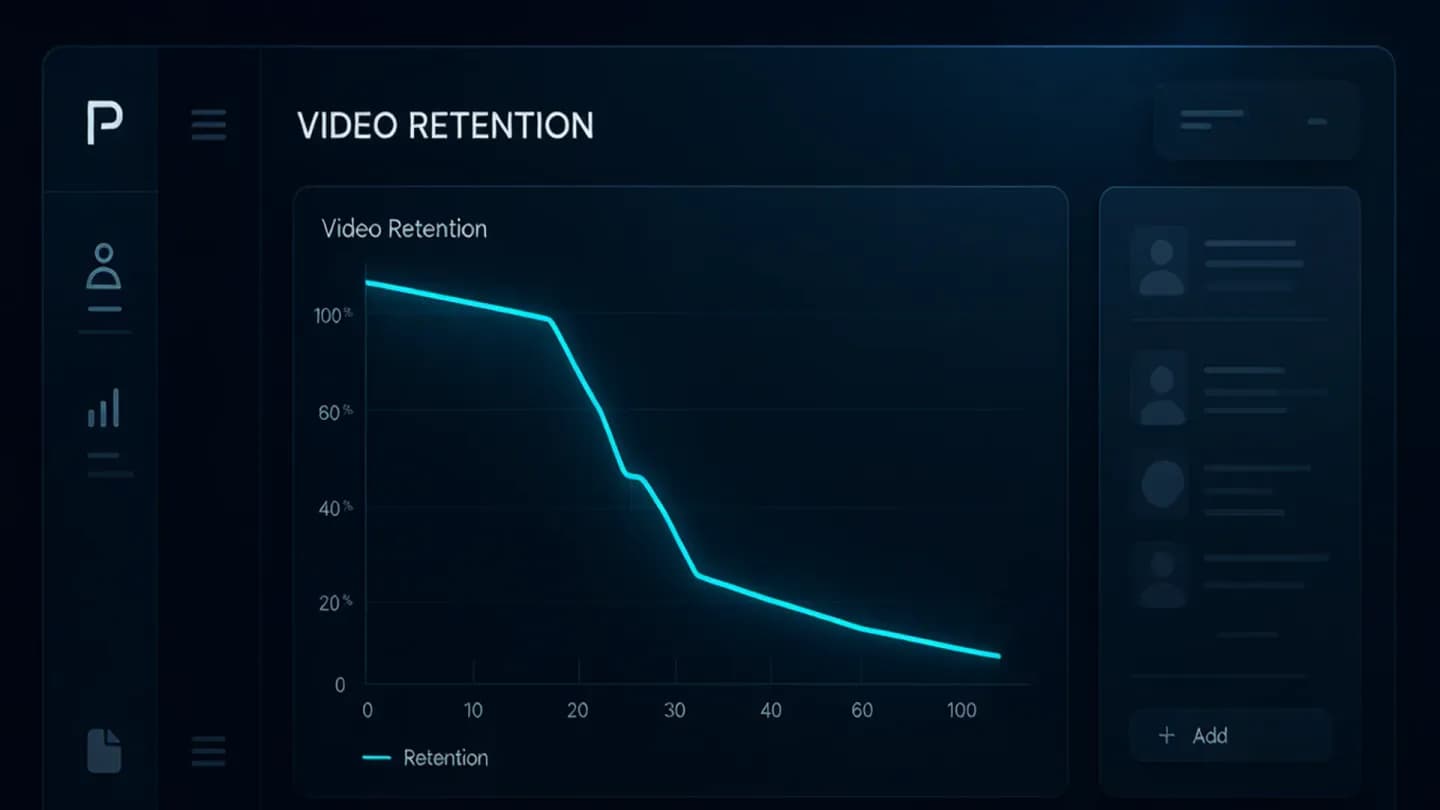
The curve is the cheapest QA signal you already have
The AI video retention curve is the one piece of performance data every team already has and almost nobody reads as a diagnostic. Platforms hand you second-by-second view-through for free, yet most AI video pipelines treat it as a post-mortem vanity chart instead of the earliest warning system for defects. When a generated cut underperforms, the instinct is to regenerate the whole thing or re-brief the model. The curve usually tells you exactly where and why the viewer left, before you spend a single token on a do-over.
Reading it as a diagnostic changes the economics of the pipeline. A cliff at second three is a hook problem, not a model problem. A dip at the 40 percent mark is drift, not bad luck. A one-second drop is a single artifact you can patch in isolation. Retention is one signal among several; {{link}} maps the others to pipeline and revenue, but the curve is the only one that pinpoints a frame. Treat it as the first read on every cut, and the rest of your QA gets cheaper because you already know what broke.
Retention is one signal among several; the video metrics that predict revenue maps the others to pipeline and revenue, but the curve is the only one that pinpoints a frame.
Baseline: what good looks like in 2026
In 2026 the benchmarks are unusually clear, which makes any deviation easy to spot. quso.ai's retention study puts the median YouTube Short at about 45 percent average view-through, with the top 10 percent holding 91 percent, and most of that loss happens in the first three seconds. A 50,000-video RetentionRail analysis found TikTok holding 72 percent average retention on sub-60-second clips, YouTube 58 percent on five-to-ten-minute videos, and Instagram Reels 45 percent, with YouTube's steepest drop landing in the 40 to 60 percent range.
Metricool's 2026 YouTube Study, built from 799,718 videos, adds the macro context: long-form views rose 76 percent year over year while engagement fell 45 percent, and 83 percent of interactions happened within the first ten days. The per-platform numbers in {{link}} give you the target each format is supposed to hit, so your own curve has a reference instead of a guess. Read those baselines as ranges, not rules, because a cooking Short and a finance Short are different products, but a curve that sits twenty points under its format median is telling you something broke.
The per-platform numbers in short-form video retention benchmarks give you the target each format is supposed to hit, so your own curve has a reference instead of a guess.
The early-drop signature on your AI video retention curve
The early-drop signature is a cliff in the first two to three seconds. On TikTok especially, drop-off concentrates in the opening moment before the hook lands; RetentionRail's data shows the platform loses viewers at the first two seconds and again at the final 10 percent. For AI video this signature almost always means the generation opened on a slow, generic build, a slow zoom on an empty room, a logo fade, or a voiceover that sets context before promising anything.
The model has no instinct for earned attention, so it defaults to a cinematic ramp that costs you the cold viewer. The fix is structural, not generative: write the first three seconds to promise the exact payoff the clip delivers, and generate or edit so the moment something happens is frame one. A clip that starts at the action rather than the setup routinely recovers ten to fifteen points of open retention, and that recovery is what separates the top decile from the median in the quso.ai data.

The mid-video cliff: where generative drift shows up
The mid-video cliff is the most damaging shape for longer AI cuts, and it is where generative drift shows up unmistakably. YouTube's retention data shows the largest mid-roll drop in the 40 to 60 percent band, roughly where sponsorship reads and B-roll transitions cluster; for AI video that zone is where a model runs out of story. Temporal drift, morphing faces, and aimless camera motion all accumulate in the middle of a generation, because the model has more frames to fill and less prompt guidance per beat.
The viewer does not consciously name the artifact, they just feel the clip get worse and leave. The defense is to keep generations short and beats explicit: treat a long idea as three short generations with hard cuts between them rather than one continuous take the model must sustain. Where the curve dips exactly at a transition, that is your signal the B-roll or the morph is the culprit, and you re-roll that segment rather than the whole spot. This is also where a pre-delivery gate earns its keep, because a human eye on the 40 percent mark catches drift that a thumbnail never reveals.
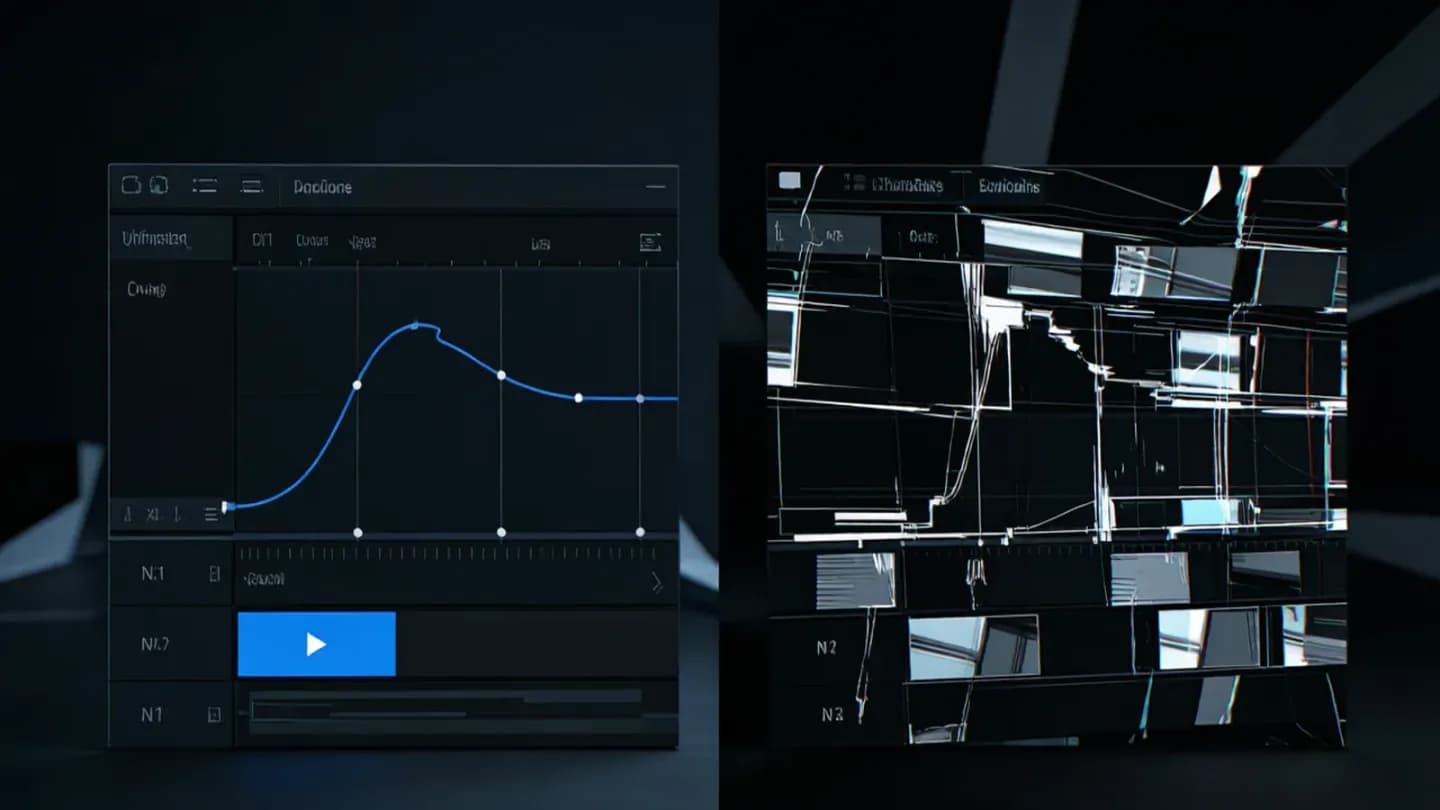
The single-second cliff: one artifact broke trust
The single-second cliff is the easiest to diagnose and the most satisfying to fix, because it points at one frame. A viewer who is fine through second fourteen and gone by second fifteen has hit a specific defect, a face morph, a broken hand, a flicker, or a rendered text glitch. YouTube Studio and TikTok analytics both let you read the curve second by second, so the steepest one-second drop is your coordinate.
When one frame breaks the spell, the production playbook for {{link}} tells you exactly which defect to hunt for and the post-production technique that survives client review. The move is surgical: locate the frame, regenerate or patch just that beat, and re-read the curve to confirm the cliff flattened. Teams that skip this step regenerate the entire clip and often reintroduce a different artifact two seconds later, trading one cliff for another while the real cause goes unrecorded.
When one frame breaks the spell, the production playbook for fixing AI video artifacts in post tells you exactly which defect to hunt for and the post-production technique that survives client review.
The flat-but-low curve: padding and aimless motion
The flat-but-low curve is the quiet failure: no dramatic cliff, just a line that sits well under the format median the whole way through. This is padding and aimless motion, the AI equivalent of dead air. quso.ai's benchmarks tie retention loss directly to padding: dead air, slow build-ups, and content that could have been cut bleed view-through steadily, and the 11 to 30 second band earns the highest median views on Shorts.
AI pipelines produce flat-but-low curves when they generate to a target length instead of a target beat, so the model fills runtime with motion that does not earn the next second. The recovery is editorial: cut everything before the payoff, loop the ending back to the opening where possible to raise re-watch rate, and let length follow the content instead of the other way around. A tighter 18-second clip almost always beats a padded 40-second one on the only metric the algorithm actually rewards, and the curve is how you prove it.
Turn the diagnosis into a production gate
The point of reading the curve is to close the loop before the next generation, not to explain the last one. Make retention part of {{link}} so a generated cut never reaches a client on hope alone: a draft that lands more than a few points under its format baseline triggers a re-read, a locate-the-drop diagnosis, and a targeted fix before approval. Instrument it cheaply, export the curve from Studio or your analytics tool, mark the steepest drop, and attach the diagnosis to the asset in your library so the next editor inherits the lesson.
Done consistently, the curve becomes a feedback channel that teaches your prompts. The defects that show up as cliffs this week stop appearing in next week's generations, because you have named them and routed each to its fix instead of regenerating blindly. Retention is not a vanity chart reserved for the monthly report. It is the most honest reviewer on the team, it works for free, and it will tell you precisely which frame lost the viewer if you are willing to look at the line instead of the thumbnail.
Make retention part of the AI video QC checklist so a generated cut never reaches a client on hope alone:
Put the framework into production
These related pages connect the article’s planning advice to a specific commercial scope.
References
- Metricool 2026 YouTube StudyMetricool
Analysis of 799,718 YouTube videos found long-form views rose 76% YoY while engagement fell 45%, Shorts views rose 127% but watch time per Short fell 3x, Shorts drove 61% of views, and 83% of interactions occurred within the first 10 days.
- What's a Good Video Retention Rate? The Benchmarksquso.ai
Median YouTube Short holds about 45% average view-through, top 10% hold 91%, most retention loss happens in the first three seconds, padding and dead air bleed view-through, and the 11-30s band earns the highest median views on Shorts.
- TikTok vs YouTube: Which platform retains viewers better in 2026?RetentionRail
Analysis of 50,000 videos found TikTok 72% avg retention on sub-60s clips, YouTube 58% on 5-10min videos, Instagram Reels 45%; TikTok drops at first 2s and final 10%, YouTube's steepest mid-video drop lands in the 40-60% range.