
The 2026 video ad benchmark is a composition, not a number
A video ad benchmark is only as useful as the traffic inside it. The 2026 dataset from Bannerflow covers more than 300 brands, 2.33 million creative assets, 155.1 billion impressions and 166.8 million clicks between 1 January and 31 August. iGaming alone supplies 76.1% of those impressions and 63.8% of the clicks. That concentration does not make the numbers wrong. It makes them specific, and it changes what a fair comparison looks like for every category outside that one.
The same analysis shows how thin video still is inside the average portfolio. Video accounted for 10.5% of the 2.33 million assets produced, while static creative carried the other 89.5%, roughly eight static assets for every video. A format can be adopted almost everywhere and still be a minority of what actually gets built, which is the first clue that a single headline rate cannot describe it.
The size of the sample is also worth holding in mind. More than 300 companies is a real dataset, but it is not the market. It is a specific set of advertisers running creative through one platform inside one eight-month window, and any reading that follows is a reading of that set rather than a law of advertising.
Benchmarks get quoted because they are the cheapest input a planning meeting has. A team pulls a platform click-through rate, sets it beside last quarter's number and decides whether the creative is working. That habit holds up when the reference set is broad and stable. It breaks when one category dominates the sample and the headline rate quietly describes that category rather than the market.
What one vertical at 76% of impressions does to a blended click-through rate
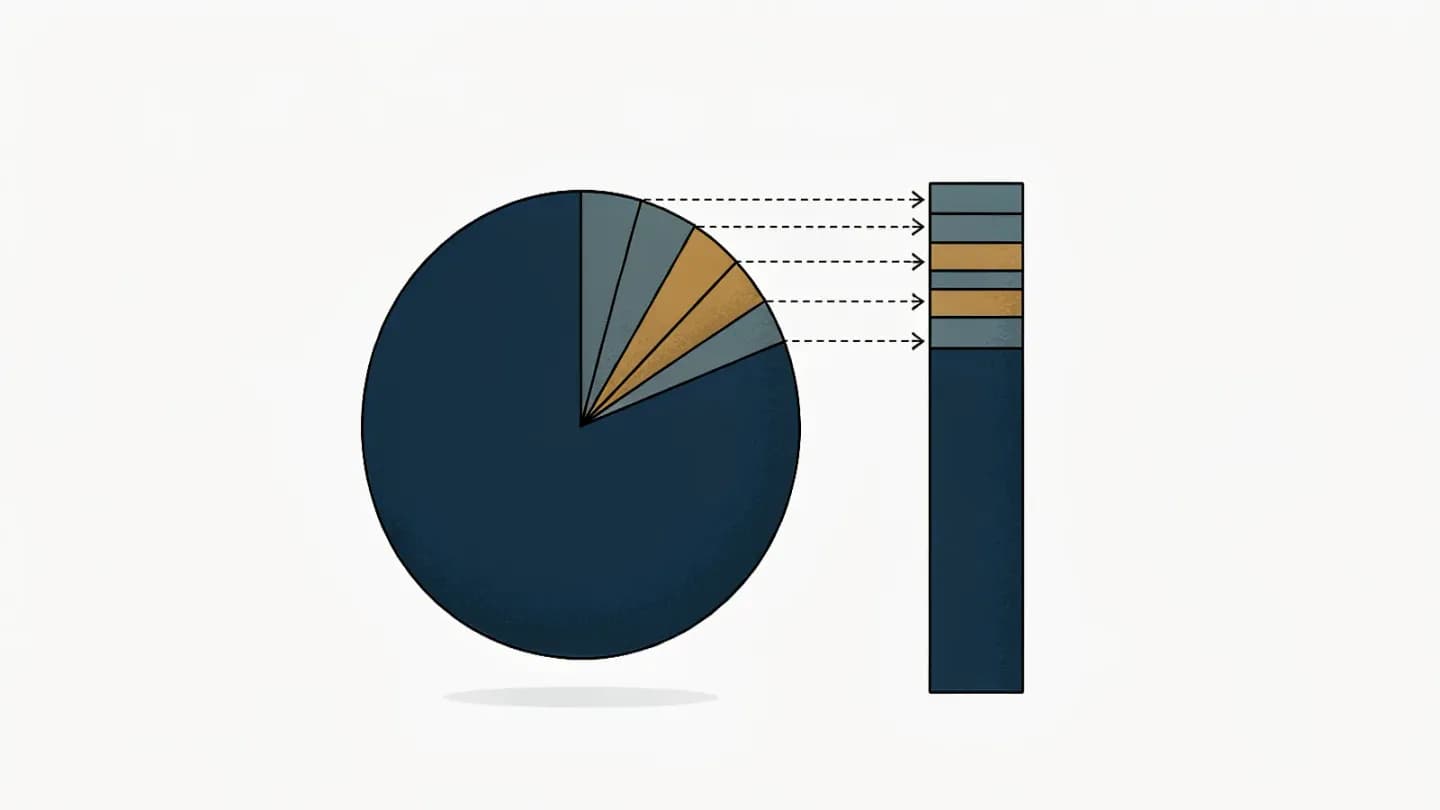
Divide those shares into the blended click-through rate of 0.108% and the arithmetic turns awkward. iGaming's 63.8% of clicks against its 76.1% of impressions implies a rate near 0.090%, below the average it is being used to define. When a single sector supplies more than three-quarters of the traffic, the blended figure is not a neutral standard. It is that sector's number with everybody else's data diluted into it.
That matters most for the brands doing the comparing. A retail team, a telecom team and a travel team all read the same 0.108% and all treat it as the baseline to beat. In practice they are being measured against an advertiser class with its own inventory, its own buying constraints and country-by-country advertising restrictions that shape what can be bought and where. A benchmark built mostly out of one regulated category inherits that category's rules.
None of this makes the dataset unusable, and it is not an argument for ignoring published sector data. It makes the average the wrong entry point. The composition is the finding, and it is what a commercial team should read first.
There is a second reason to be careful with the headline. The same commentary pairs the sector click data with a warning that broad-reach and high-intent campaigns do different jobs, so reach and click-through rate need to be interpreted in context. The release does not classify campaigns by objective, which means the sector rates are being compared across unknown mixes of reach buying and response buying. At that level the comparison is directional at best.
Travel and telecom show why more video is not the same as more clicks
The sector detail is where the dataset earns its keep. Travel generated 11.0% of the clicks from 4.3% of the impressions, a blended click-through rate of 0.274% and more than 2.5 times the platform rate. Telecom ran 24.1% of its impressions as video and recorded 0.208%, nearly twice the platform rate. Two categories, two strong results, and one detail worth pausing on.
Travel carried a lower video share than telecom, 12.5% against 24.1%, and still posted the higher click-through rate. If video volume drove clicks, the order would be reversed. The tidy story that more video buys more response does not survive contact with the sector table. The dataset says as much about itself: both rates are blended, mixing video and static delivery into one figure, so neither can be attributed to the video assets inside it.
The spread between the implied low and the reported high runs from roughly 0.090% to 0.274%, close to a threefold range. That spread is a more useful fact than the average sitting in the middle of it. One headline number compresses three different behaviours into a single line, then invites teams to treat the line as a target.
None of this argues against video. It argues against using a blended, cross-sector rate as the test. A travel campaign judged against 0.108% looks like an overperformer and a channel decision may be made on that read. The same campaign judged against 0.274% looks average. Identical delivery, opposite conclusions, one number apart.
What the sector split means for your own video ad benchmark
Before quoting any benchmark, the 2026 data suggests three questions. How concentrated is the sample, and is your category even represented in it? Is the number you are reading blended, so that video and static delivery are sharing one average? And what mix of objectives produced it, because a broad-reach campaign and a high-intent performance campaign are not trying to do the same job. Format fit sits underneath all three: the {{link}} maps where generative video earns its keep and where it does not.
The third question is the one teams skip. Clicks are an imperfect scorecard for a format often bought for reach or completed views, and connected television can deliver its full value without producing a single click. That does not make click-through rate useless. It makes it conditional, and the {{link}} covers how that conditionality is handled when a video buy is priced and slow to prove.
The same conditionality applies to brand-side evidence. Reach and click-through rate need to be read against the campaign objective rather than against each other, and the {{link}} describes the measurement stack that keeps those two questions separate instead of collapsing them into one number.
Format fit sits underneath all three: the AI video content-type fit maps where generative video earns its keep and where it does not.
It makes it conditional, and the AI video incrementality testing covers how that conditionality is handled when a video buy is priced and slow to prove.
Reach and click-through rate need to be read against the campaign objective rather than against each other, and the AI video brand lift measurement describes the measurement stack that keeps those two questions separate instead of collapsing them into one number.
How to build a comparison set you can act on
The workable alternative is a comparison set built from your own delivery data. Compute your category's share of impressions and clicks first, then split video from static so the rate you are tracking belongs to the format you are judging. A blended rate tells you how a campaign performed. A format-level rate tells you whether the format did.
Segment the set by objective before you segment it by creative. Reach buying and conversion buying need different scorecards, and mixing them produces an average that flatters neither. The {{link}} describes how that discipline holds when generation and media buying share one pipeline.
Then ask the question the sector table actually raises. In the 2026 dataset the category with the strongest response carried the lower video share, which is a prompt to test share of voice rather than a licence to raise it. Creative weight is decided inside the auction before any budget line moves, and the {{link}} explains what that weight is made of.
Finally, hold any shift in share of voice behind a test rather than a benchmark. If your category looks under-weighted on video relative to its response, the finding justifies a holdout, not a reallocation. The point of reading the composition is to know which experiment is worth running, and that is a different question from which number looks best on a slide.
The AI video programmatic creative describes how that discipline holds when generation and media buying share one pipeline.
Creative weight is decided inside the auction before any budget line moves, and the creative auction weight explains what that weight is made of.

The benchmark is a starting question, not a target
Two honest limitations belong beside these numbers. The release does not disclose how many brands operate in each vertical, so iGaming's weight could reflect a handful of very large advertisers rather than a broad pattern across the category. It also does not break out video-only click-through rates, which is exactly why the sector figures stay blended and why nobody can yet claim that video caused the travel result.
The people publishing the standards reached that conclusion first. The 21st edition of the IAS Media Quality Report added vertical benchmarks to its global media quality analysis because risk diverged by region, vertical and content type, which it describes as the limits of one-size-fits-all strategies. Composited averages had stopped being sufficient for the organisations writing the benchmarks, not only for the teams reading them.
What survives is a habit rather than a figure. Read the composition before the average, put your own category beside the comparison instead of underneath it, and treat a spread that runs from 0.090% to 0.274% as evidence that the average was never the target. A benchmark is the question you start from, and the sector table is what makes the question worth asking.
Put the framework into production
These related pages connect the article’s planning advice to a specific commercial scope.
References
- Only 46% of brands serve video ads despite 78% producing them: BannerflowMediaNews4U
Bannerflow analysed anonymised data from 300+ brands active on its platform between 1 January and 31 August 2026, covering 2.33 million creative assets, 155.1 billion ad impressions and 166.8 million clicks; video was 10.5% of assets against 89.5% for static; iGaming accounted for 76.1% of impressions and 63.8% of clicks; travel generated 11.0% of clicks from 4.3% of impressions with a 0.274% blended click-through rate; telecom ran 24.1% of impressions as video at 0.208%; the platform-wide blended rate was 0.108%.
- Media Quality Report: 21st EditionIntegral Ad Science
IAS's Media Quality Report, 21st edition, published 9 July 2026, added vertical benchmarks and monthly performance trends to its global and regional media quality analysis, and reports that media quality improved meaningfully at the global level while risk diverged by region, vertical and content type, which it describes as underscoring the limits of one-size-fits-all strategies; the report also finds that mobile web display accounts for 45% of impressions and that video outperformed display in viewability by an 11.8 percentage-point margin.
- 2026 IAB Digital Video Ad Spend & Strategy ReportInteractive Advertising Bureau
IAB's 2026 Digital Video Ad Spend & Strategy Report projects that US digital video ad spend will surpass $80 billion in 2026 and continue to outpace the broader ad market, reports that targeting and audience reach now rank alongside business outcomes as top decision-making criteria for video investment, notes that confidence in inventory quality remains a challenge across all buying methods, and finds that GenAI adoption for video creative keeps accelerating even as many advertisers want more proof of performance and easier workflow integration.