Why most AI video benchmarks quote the wrong denominator
Most AI video benchmarks fail the moment you quote them, because the number was never measuring what you assumed it was. A 2.60 percent TikTok engagement rate, a 'good' 5 percent, a three-second hook rule — each hides a denominator, a skewed distribution or a missing sample. The fix is not a better benchmark. It is benchmark literacy: five checks that turn a decorative statistic into a defensible decision.
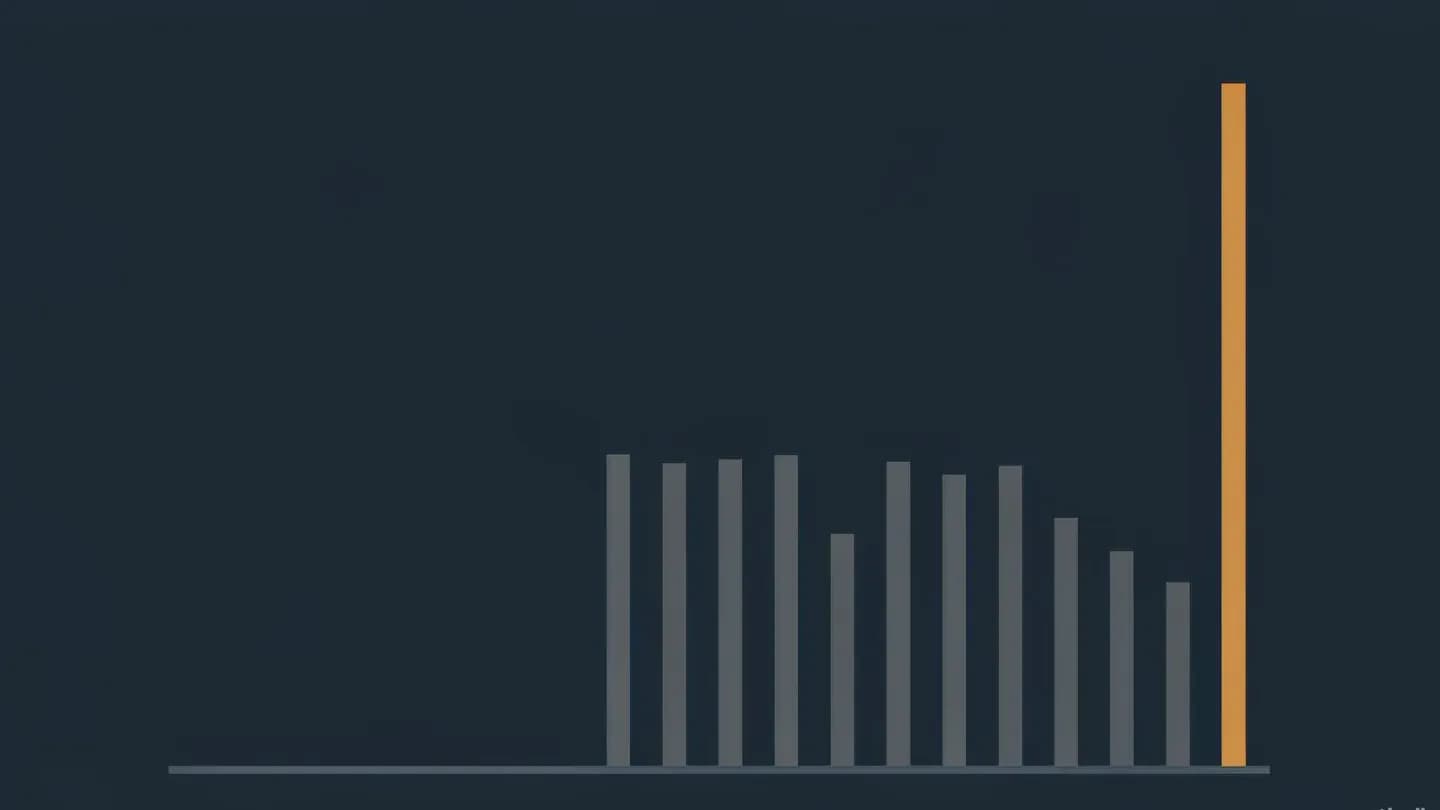
Start with the number marketing teams quote most. Socialinsider's 2026 cross-platform study of 69 million TikTok, Reels and Shorts videos, published in August 2026, puts the average engagement rate at 2.60 percent on TikTok, 0.45 percent on Instagram Reels and 0.30 percent on YouTube Shorts, with TikTok down from 3.70 percent the year before. A second respected dataset, Metricool's account-relative method cited in sepia-lab's 2026 statistics roundup, reports 6.1 percent on TikTok and 8.24 percent on Instagram for short-form content. Both are correct. One divides interactions by follower count across all post types; the other measures engagement relative to accounts, scoped to short-form only. Neither is a platform truth, and quoting either without its formula invites a decision built on the wrong base.
The 2.60 percent TikTok average sits inside {{link}}, and reading it correctly depends on knowing which denominator produced it.
The 2.60 percent TikTok average sits inside how the 2026 platform engagement averages were built, and reading it correctly depends on knowing which denominator produced it.
The mean-versus-median trap in view counts
The second failure mode lives inside the word 'average'. OverseerOS analysed 2,580 mature long-form YouTube videos across 67 channels and found that the median channel's arithmetic mean was 1.97 times its median. The top single video generated 19.6 percent of that channel's qualifying views, the top 10 percent generated 48.7 percent, and the top 20 percent generated 64.6 percent. When a distribution concentrates that hard, the mean describes the winners while the median describes the typical video, and almost every casual comparison quotes the mean.
The practical fix is channel-relative vocabulary instead of absolute numbers. In that same study, a top-quartile video ran about 2.14 times the channel median, a top-10-percent video about 4.62 times, and a top-5-percent video about 7.33 times. A video with 92,400 views means nothing until you know the channel's own baseline: against a 20,000-view median it is a top-decile asset, and against a 60,000-view median it is barely typical. That concentration is the same mechanism behind {{link}}, which is why averages keep flattering the typical video.
The same skew applies to engagement. OverseerOS's 2,251-video sample puts the median long-form engagement rate at 3.48 percent with the top quartile at 4.91 percent, so a '5 percent engagement' goal sits near the top decile on one definition and barely above average on another.
That concentration is the same mechanism behind the paid-social power law behind concentrated outcomes, which is why averages keep flattering the typical video.
Cohort confusion: when benchmark tables invent a trend
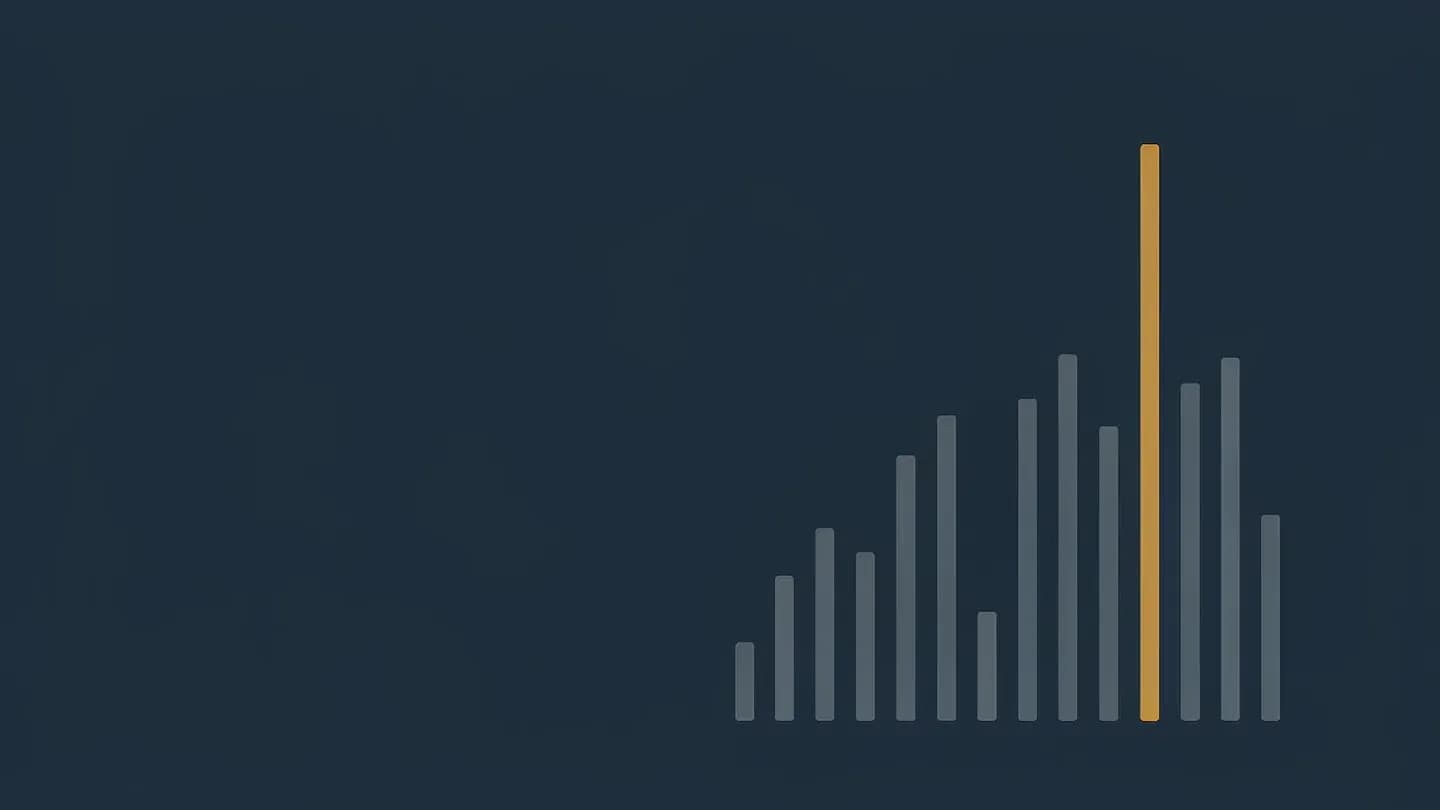
Benchmark tables also manufacture trends that do not exist. OverseerOS publishes pooled medians for long-form views at day 7 (28,604), day 30 (27,831) and day 90 (45,608), and explicitly warns that these come from different research cohorts. Read as a curve, views appear to fall between day 7 and day 30, which is impossible for a single video. Only tracking the same video across checkpoints measures accumulation; cross-sectional samples answer a different question about typical performance at each age.
The same caution applies to any framework assembled from overlapping samples. The six OverseerOS studies cover 2,580, 2,043, 2,251, 436, 1,051 and 1,035 videos plus 89 repeatedly observed channels, overlapping in places and explicitly not additive. A deck that merges them into one 'dataset of 9,000 videos' has invented a sample that no study supports. Socialinsider's own methodology note shows why sample identity matters too: its engagement rate is calculated per post by followers, with TikTok counting likes, comments and shares while Instagram and YouTube count only likes and comments, so even its internal cross-platform table mixes formulas. Sector mix adds one more layer, because {{link}} can concentrate three quarters of a dataset's impressions in a single vertical.
Sector mix adds one more layer, because how sector-level benchmark skew distorts fair comparison can concentrate three quarters of a dataset's impressions in a single vertical.

The folklore numbers: the three-second rule and the carousel war
Some of the most-quoted numbers in short-form video have no primary source at all. Fastlane's September 2026 methodology audit traced every instance of the claim that 71 percent of TikTok viewers decide within three seconds, and the '30 percent thumb-stop rate' figure for Meta, back to third-party blogs citing TikTok for Business or Facebook reports with no linkable original document. No published study with a stated sample supports a specific percentage. The principle, that the first seconds decide distribution, is real; the precise figures are folklore.
Contradictory benchmarks are the second trap. On whether carousels beat video on TikTok, Buffer's analysis of more than 4 million posts found video ahead by 77 percent, while Fanpage Karma's study of roughly 700,000 posts found carousels ahead by 81 percent. Different samples, date ranges and engagement definitions were enough to flip the result. On Instagram both agree carousels engage more, yet Reels still earn more reach, which is why format decisions cannot be outsourced to a single stat. The honest position pairs {{link}} with a refusal to quote unsourced percentages.
The honest position pairs the proof gap behind unsourced marketing numbers with a refusal to quote unsourced percentages.
The five-question checklist for any benchmark
Run every borrowed number through five questions before it reaches a brief or a budget. First, what is the denominator: engagement per follower, per view, per impression or per account? Second, is the headline figure a mean or a median, and how skewed is the distribution behind it? Third, do the samples share one cohort, or is the comparison mixing video ages, formats and time windows? Fourth, is there a linkable primary study with a stated sample, or does the trail end at a blog citing another blog? Fifth, is every number in the comparison drawn from a single methodology, as sepia-lab's citation checklist demands, rather than switched between providers mid-table?
Two refinements make the checklist operational. Read volume and attention as a pair, never separately: Metricool's data shows short-form posts up 71 percent year over year while average TikTok view time fell from 4.72 to 3.75 seconds and only about 4 percent of videos are watched in full, so quoting only the growth number tells half the story. And treat any benchmark older than one research cycle as expired, because the same publisher's figures moved materially between its 2025 and 2026 editions.
The endgame is {{link}}, where your own controlled tests replace every external average.
The endgame is incrementality testing as the replacement for borrowed averages, where your own controlled tests replace every external average.
Benchmarks are context; your own account is the baseline
The final rule is an ordering, not a number. OverseerOS frames it as a hierarchy: benchmark the video against your own channel first, then the same format, then the same video age, then similar channel sizes, and only last against broad platform data. Their engagement research makes the ordering concrete: the channel-weighted median for recent long-form videos was 3.48 percent on a likes-plus-comments-over-views definition that other studies do not share, which is exactly why the hierarchy starts at home.
External benchmarks still earn their place as context. They tell you whether your baseline is competitive, and they frame a budget conversation when a deck needs market evidence. They also age quickly, which is why the same publisher's averages can move materially between research cycles and still both be correct.
Write the defensible version of every number you circulate: definition, denominator, time window, sample and percentile. 'In a 69-million-video 2026 sample, the average TikTok engagement rate was 2.60 percent, follower-relative, down from 3.70 percent' is longer than 'TikTok engagement is 2.6 percent.' It is also the only version that survives contact with a media buyer who asks what the number is actually made of.
Put the framework into production
These related pages connect the article’s planning advice to a specific commercial scope.
References
- TikTok vs. Reels vs. Shorts: 2026 Engagement DataSocialinsider
Socialinsider's August 2026 study analyses 69 million Shorts, Reels and TikTok videos posted between January 2025 and July 2026. It reports average engagement rate falling from 3.70 percent in 2025 to 2.60 percent in 2026 on TikTok, with Instagram Reels at 0.45 percent and YouTube Shorts at 0.30 percent, and average comments per video of 50 on TikTok, 20 on Reels and 10 on Shorts. Its methodology defines engagement rate per post by followers, counting likes, comments and shares for TikTok but only likes and comments for Instagram and YouTube.
- YouTube Benchmarks 2026: Views, Engagement, Growth & Subscriber Data From 6 StudiesOverseerOS
OverseerOS's September 2026 synthesis of six public-data studies, including 2,580 mature long-form videos across 67 channels, found the median channel's arithmetic mean views were 1.97 times its median, with the top video generating 19.6 percent of qualifying views, the top 10 percent 48.7 percent and the top 20 percent 64.6 percent. The report warns that its pooled day-7 (28,604), day-30 (27,831) and day-90 (45,608) view medians come from different cohorts and must not be read as one video's growth curve, and recommends benchmarking your own channel first, then format, video age, channel size and broad external data last.
- Short-Form Video Benchmarks 2026: TikTok vs Reels vs ShortsFastlane
Fastlane's September 2026 benchmark guide states that no primary study with a stated sample supports the widely quoted figures that 71 percent of TikTok viewers decide within 3 seconds or that a good thumb-stop rate on Meta is 30 percent; every instance traced back to third-party blogs without a linkable original document. The same page reports that Buffer's analysis of more than 4 million posts finds TikTok video ahead of carousels by 77 percent while Fanpage Karma's study of about 700,000 posts finds carousels ahead by 81 percent, with differing samples and engagement definitions flipping the result.
- Short-Form Video Statistics 2026: ROI and EngagementSepia
Sepia's June 2026 statistics roundup shows Socialinsider's follower-relative method reporting TikTok engagement at 3.70 percent while Metricool's account-relative short-form method reports 6.1 percent on TikTok and 8.24 percent on Instagram, and warns readers to never present a Socialinsider rate and a Metricool rate as the same metric. The report also notes average TikTok view time fell from 4.72 to 3.75 seconds with only about 4 percent of videos watched in full against a 41-second average length, and that a view is not standardised across platforms, so average-views tables are directional rather than apples-to-apples.