
The 2026 YouTube Shorts vs long-form numbers: Shorts found the audience, long-form kept it
The YouTube Shorts vs long-form decision is now the central 2026 call for any team publishing AI video on the platform. The platform's own economics shifted underneath everyone running video on it. Metricool's 2026 YouTube Study analyzed 799,718 videos from 71,177 accounts and found long-form views up 76% year over year while engagement fell 45%, and Shorts views up 127% year over year even as viewers spent three times less time on each Short. The Shorts feed alone generated 61% of all YouTube views. Reach is up across the board, but the time and attention behind that reach moved in opposite directions by format.
That single dataset is the cleanest description of the 2026 problem a commercial video team faces on YouTube. You are not choosing between a growing audience and a shrinking one. You are publishing into a system where the short format is now the front door and the long format is the room people actually stay in. Treating them as one content type measured by one scorecard is the mistake that burns most AI video budgets this year.
Monetization tells the same story from the other side. Ad impressions, monetized playbacks and estimated ad revenue all fell more than 50% even as view counts climbed. The platform is handing out more impressions and converting fewer of them into money or loyalty, which means the value of a view now depends entirely on which format delivered it and what the viewer did next.

Why the same AI video performs two different ways
A clip generated by the same pipeline behaves nothing like itself once it is cut for Shorts versus long-form. In the Shorts feed it is competing on completion: the algorithm serves content by how completely people watch it, so a 30-second generated beat either gets finished or gets buried. RetentionRail's cross-platform study of 50,000 videos puts TikTok under-60s retention at 72% and YouTube 5-to-10-minute video at 58%, with Instagram Reels lowest at 45% - but those averages hide the job each format is doing.
The job is different because the relationship is different. On Shorts the viewer owes you nothing; they scrolled in and they will scroll out. On long-form the viewer who stays past the five-minute mark is a different kind of asset - RetentionRail found those viewers comment, subscribe and share at three to four times the rate of short-form viewers. Your AI-generated explainer is not the same piece of content in the two placements. It is a discovery ad in one and a relationship-builder in the other.
This is why a 'one master, chop it for every surface' habit quietly underperforms. The long-form version earns its keep through mid-video retention and the trust that builds; the Shorts version earns its keep through a hook strong enough to survive the first two seconds and a payoff fast enough to beat the drop-off at the final 10%. Same source footage, two completely different success criteria.
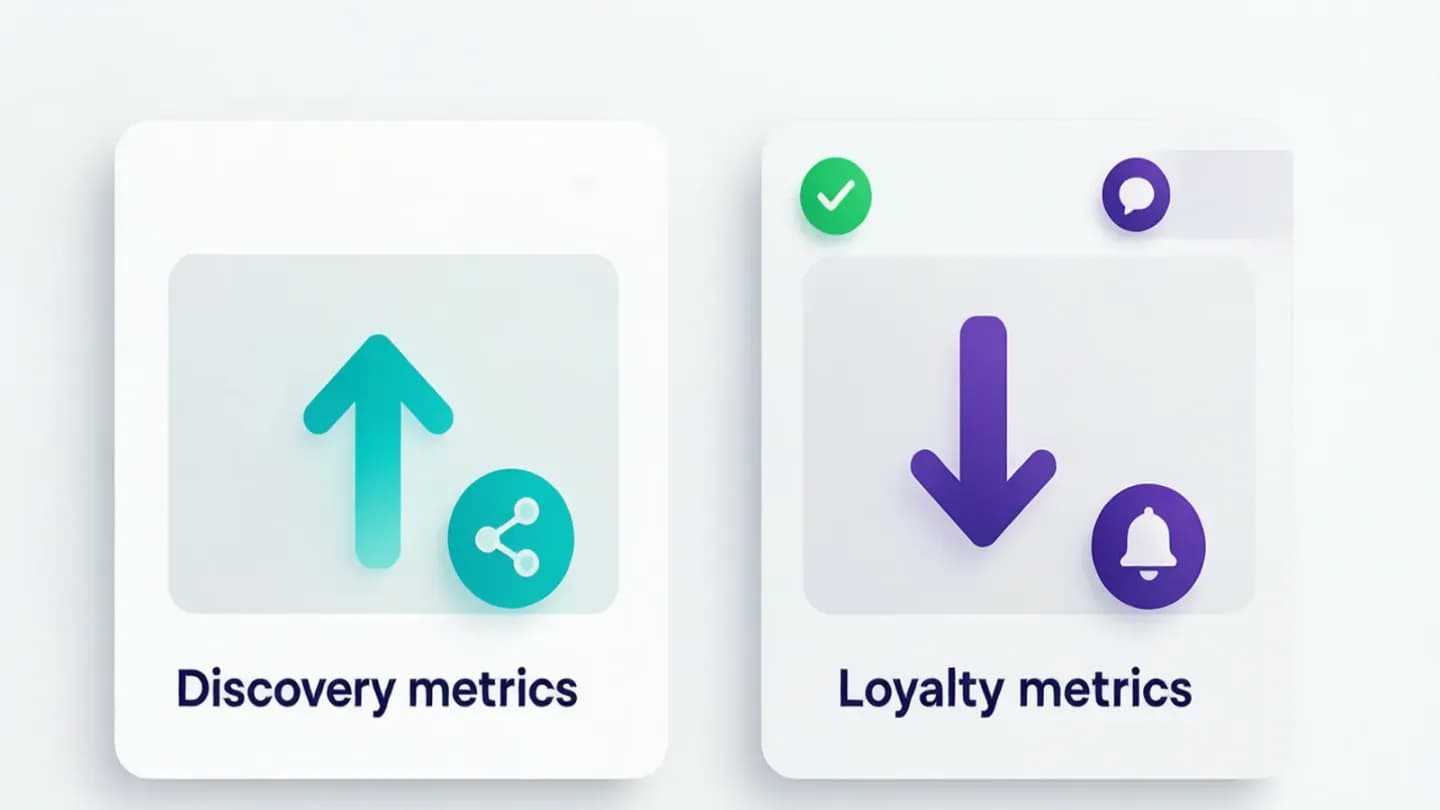
Measure Shorts on discovery, long-form on loyalty
The fix starts with the scorecard. Stop reporting Shorts and long-form against the same north-star metric and you immediately stop punishing the format that is doing the job it was built for. For Shorts, the metrics that matter are views, saves, shares and completion rate - the signals that the algorithm reads as 'worth pushing to more feeds.' For long-form, average view duration and the comment, subscribe and share rate are the loyalty indicators that compound into a channel people return to.
Teams that {{link}} are already scoring AI video on two different scorecards. They celebrate a Short for hitting a completion target and a long-form video for holding past the five-minute mark, instead of mourning that the Short 'only' averaged eight seconds of watch time. The 2026 data rewards that split: 83% of all interactions on YouTube happened within the first ten days of a video's life, so the discovery format has to win fast and the long format has to convert that attention into a relationship before the window closes.
A practical rule is to set a target per format and review them separately. Shorts: aim for the retention band the platform expects by length, not by copying long-form expectations. Long-form: treat the 40-to-60% range as the danger zone where sponsorship reads and B-roll transitions cluster, and put your key reveal before it. Measuring each against its own standard is the difference between a dashboard that informs you and one that misleads you.
Teams that track the video metrics that predict revenue are already scoring AI video on two different scorecards.
Build a two-track production split for AI video
Once the metrics are split, the production plan splits with them. Generate with the end placement in mind rather than generating once and hoping the edit rescues it. For the Shorts track, brief the model for a self-contained 15-to-40-second beat with the hook in frame one and the payoff before the final 10% - the exact drop-off points the retention data flags. For the long-form track, brief for a narrative arc that earns the five-minute mark, because that is the threshold where loyalty behaviors switch on.
This does not mean doubling your generation cost. It means routing the same concept through two intentional cuts instead of one generic master. In practice the Shorts version is a vertical, hook-first extraction; the long-form version is the fuller story with the mid-video reveal, the proof points and the brand context that a scroller would never sit through. The AI pipeline produces both from one brief if you specify the two deliverables up front.
The teams that scale this treat the split as a standing workflow, not a one-off. A new campaign generates a long-form hero and its Shorts derivatives in the same pass, each with a defined success metric and a defined review window. That is how AI video stops being a volume game where everything is measured the same and starts being a portfolio where each asset is judged on the job it was hired to do.
Where the retention curve decides your cut
The retention curve is the cheapest QA signal you already have, and it reads differently by format. On long-form the curve exposes exactly where you lose people, which is almost always the opening thirty seconds and the 40-to-60% band. Before you trim a long-form cut, {{link}} to find the exact second viewers leave. Fix that moment with a stronger beat or a tighter transition rather than assuming the whole concept failed.
For target numbers by length, {{link}} give the Shorts and TikTok ranges teams are held to. YouTube Shorts under 30 seconds average 50-to-65% retention with strong performance above 65%, while 30-to-60-second Shorts sit at 40-to-50%, and TikTok under 15 seconds averages 60-to-70%. Those bands are your pass-fail line when you review a generated Short, not a vague sense of whether it 'felt good.' A Short at 38% retention under 30 seconds is underperforming by a clear margin; one at 70% is a winner you should promote, not just publish.
Use the curve to decide which generated take survives. When hook rate drops but hold rate stays flat, you have a hook problem and a hook swap fixes it. When both fall, the concept itself is tired and no amount of regeneration of the same angle will save it. Reading the shape - early drop, mid-video cliff, flat-but-low - points to a specific AI video defect and the fix that recovers it, which is far cheaper than shipping blind.
Before you trim a long-form cut, read the retention curve to find the exact second viewers leave.
For target numbers by length, per-platform retention benchmarks give the Shorts and TikTok ranges teams are held to.
Don't let the engagement decline fool you
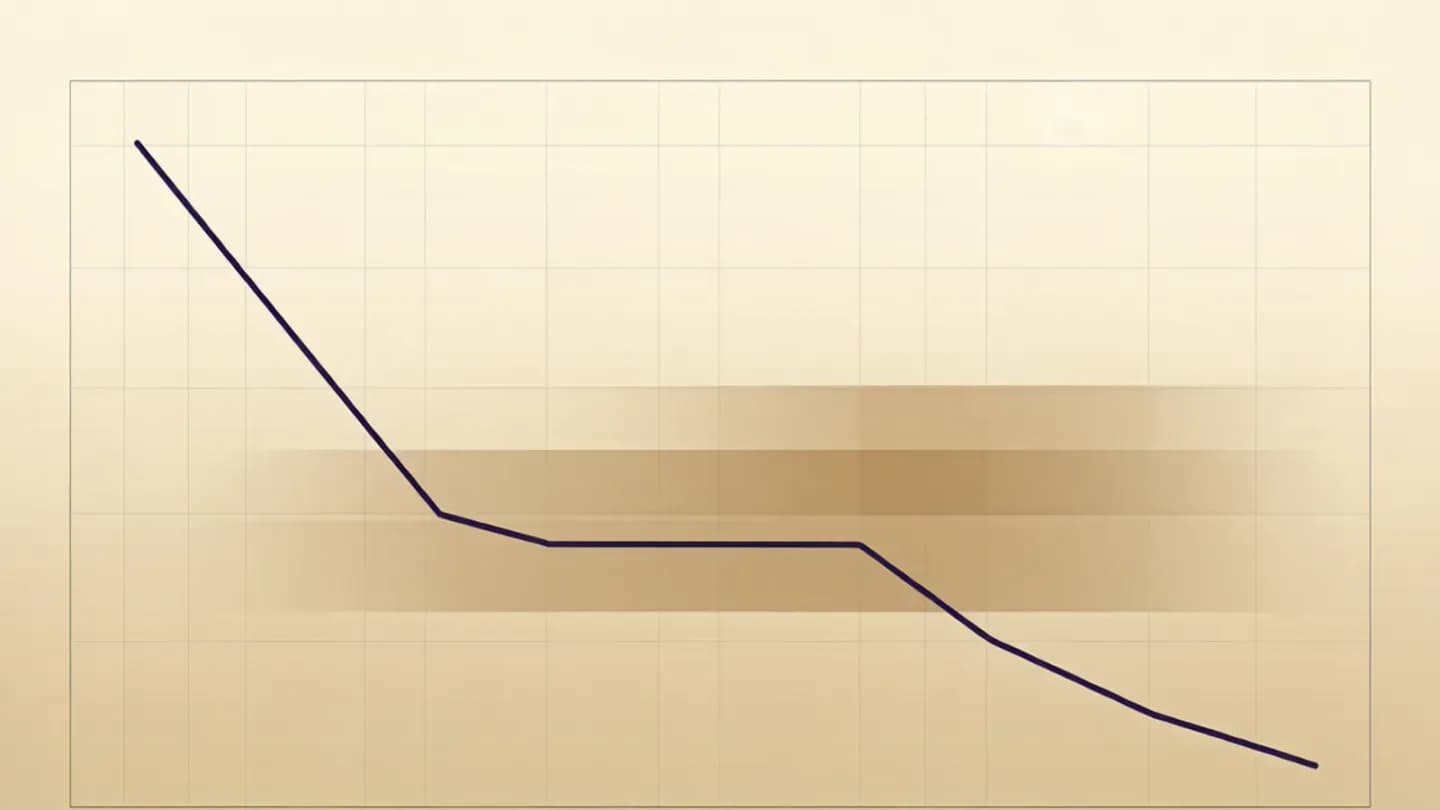
The temptation after reading any of this is to conclude that YouTube 'doesn't work anymore' because engagement is down 45%. That reading is wrong and it is also expensive. What looks like a flatline is really {{link}} across the whole platform. Reach is way up, the attention behind it is thinner and more fragmented, and the value has moved from raw views to retained, loyal viewers.
The 2026 advantage goes to teams that stop optimizing for the view count and start optimizing for the job. Shorts pull strangers in; long-form turns the ones who stay into subscribers, sharers and eventually customers. Neither format is 'better,' and neither is dying. They are two stages of one funnel, and the AI video teams winning this year are the ones who staff, measure and produce both instead of arguing about which one counts.
The practical takeaway is unglamorous: publish Shorts to be found and long-form to be kept, judge each on its own scorecard, and let the retention curve tell you which generated cut lives or dies. The data is already published and the bands are already known. The only thing left is to stop measuring one video as if it had one job.
What looks like a flatline is really the 2026 engagement-decline pattern across the whole platform.
Put the framework into production
These related pages connect the article’s planning advice to a specific commercial scope.
References
- Metricool 2026 YouTube StudyMetricool
Analysis of 799,718 YouTube videos from 71,177 accounts found long-form views up 76% year over year while engagement fell 45%, Shorts views up 127% year over year with three times less watch time per Short, and the Shorts feed drove 61% of all YouTube views; 83% of interactions occurred within the first 10 days.
- TikTok vs YouTube retention, 2026RetentionRail
Across 50,000 videos published January to March 2026, YouTube viewers who stay past five minutes comment, subscribe and share at three to four times the rate of TikTok viewers, and YouTube drop-off concentrates in the first 30 seconds and the 40-60% range.
- Audience retention benchmarks 2026Retensis
2026 benchmarks put YouTube Shorts under 30 seconds at 50-65% average retention (strong above 65%) and 30-60 seconds at 40-50%, while TikTok under 15 seconds averages 60-70% and 30-60 seconds averages 40-50%.